DynamicMALibrary "DynamicMA"
Dynamic Moving Averages Library
Introduction
The Dynamic Moving Averages Library is a specialized collection of custom built functions designed to calculate moving averages dynamically, beginning from the first available bar. Unlike standard moving averages, which rely on fixed length lookbacks, this library ensures that indicators remain fully functional from the very first data point, making it an essential tool for analysing assets with short time series or limited historical data.
This approach allows traders and developers to build robust indicators that do not require a preset amount of historical data before generating meaningful outputs. It is particularly advantageous for:
Newly listed assets with minimal price history.
High-timeframe trading, where large lookback periods can lead to delayed or missing data.
By eliminating the constraints of fixed lookback periods, this library enables the seamless construction of trend indicators, smoothing functions, and hybrid models that adapt instantly to market conditions.
Comprehensive Set of Custom Moving Averages
The library includes a wide range of custom dynamic moving averages, each designed for specific analytical use cases:
SMA (Simple Moving Average) – The fundamental moving average, dynamically computed.
EMA (Exponential Moving Average) – Adaptive smoothing for better trend tracking.
DEMA (Double Exponential Moving Average) – Faster trend detection with reduced lag.
TEMA (Triple Exponential Moving Average) – Even more responsive than DEMA.
WMA (Weighted Moving Average) – Emphasizes recent price action while reducing noise.
VWMA (Volume Weighted Moving Average) – Accounts for volume to give more weight to high-volume periods.
HMA (Hull Moving Average) – A superior smoothing method with low lag.
SMMA (Smoothed Moving Average) – A hybrid approach between SMA and EMA.
LSMA (Least Squares Moving Average) – Uses linear regression for trend detection.
RMA (Relative Moving Average) – Used in RSI-based calculations for smooth momentum readings.
ALMA (Arnaud Legoux Moving Average) – A Gaussian-weighted MA for superior signal clarity.
Hyperbolic MA (HyperMA) – A mathematically optimized averaging method with dynamic weighting.
Each function dynamically adjusts its calculation length to match the available bar count, ensuring instant functionality on all assets.
Fully Optimized for Pine Script v6
This library is built on Pine Script v6, ensuring compatibility with modern TradingView indicators and scripts. It includes exportable functions for seamless integration into custom indicators, making it easy to develop trend-following models, volatility filters, and adaptive risk-management systems.
Why Use Dynamic Moving Averages?
Traditional moving averages suffer from a common limitation: they require a fixed historical window to generate meaningful values. This poses several problems:
New Assets Have No Historical Data - If an asset has only been trading for a short period, traditional moving averages may not be able to generate valid signals.
High Timeframes Require Massive Lookbacks - On 1W or 1M charts, a 200-period SMA would require 200 weeks or months of data, making it unusable on newer assets.
Delayed Signal Initialization - Standard indicators often take dozens of bars to stabilize, reducing effectiveness when trading new trends.
The Dynamic Moving Averages Library eliminates these issues by ensuring that every function:
Starts calculation from bar one, using available data instead of waiting for a lookback period.
Adapts dynamically across timeframes, making it equally effective on low or high timeframes.
Allows smoother, more responsive trend tracking, particularly useful for volatile or low-liquidity assets.
This flexibility makes it indispensable for custom script developers, quantitative analysts, and discretionary traders looking to build more adaptive and resilient indicators.
Final Summary
The Dynamic Moving Averages Library is a versatile and powerful set of functions designed to overcome the limitations of fixed-lookback indicators. By dynamically adjusting the calculation length from the first bar, this library ensures that moving averages remain fully functional across all timeframes and asset types, making it an essential tool for traders and developers alike.
With built-in adaptability, low-lag smoothing, and support for multiple moving average types, this library unlocks new possibilities for quantitative trading and strategy development - especially for assets with short price histories or those traded on higher timeframes.
For traders looking to enhance signal reliability, minimize lag, and build adaptable trading systems, the Dynamic Moving Averages Library provides an efficient and flexible solution.
SMA(sourceData, maxLength)
Dynamic SMA
Parameters:
sourceData (float)
maxLength (int)
EMA(src, length)
Dynamic EMA
Parameters:
src (float)
length (int)
DEMA(src, length)
Dynamic DEMA
Parameters:
src (float)
length (int)
TEMA(src, length)
Dynamic TEMA
Parameters:
src (float)
length (int)
WMA(src, length)
Dynamic WMA
Parameters:
src (float)
length (int)
HMA(src, length)
Dynamic HMA
Parameters:
src (float)
length (int)
VWMA(src, volsrc, length)
Dynamic VWMA
Parameters:
src (float)
volsrc (float)
length (int)
SMMA(src, length)
Dynamic SMMA
Parameters:
src (float)
length (int)
LSMA(src, length, offset)
Dynamic LSMA
Parameters:
src (float)
length (int)
offset (int)
RMA(src, length)
Dynamic RMA
Parameters:
src (float)
length (int)
ALMA(src, length, offset_sigma, sigma)
Dynamic ALMA
Parameters:
src (float)
length (int)
offset_sigma (float)
sigma (float)
HyperMA(src, length)
Dynamic HyperbolicMA
Parameters:
src (float)
length (int)
Cari dalam skrip untuk "Exponential Moving Average"

Filtered ATR with EMA OverlayFiltered ATR with EMA Overlay is an advanced volatility indicator designed to provide a more accurate representation of market conditions by smoothing the standard Average True Range (ATR). This is achieved by filtering out extreme price movements and abnormal bars that can distort traditional ATR calculations.
The indicator applies an Exponential Moving Average (EMA) to the filtered ATR, creating a dual-layered system that highlights periods of increased or decreased volatility.
Key Features:
Filtered ATR: Filters out extreme bars, reducing noise and making the ATR line more reliable.
EMA Overlay: An EMA (default period of 10) is applied to the filtered ATR, allowing traders to track average volatility trends.
Volatility Signals:
Filtered ATR > EMA(10): Indicates higher-than-average volatility. This often correlates with trend breakouts or strong price movements.
Filtered ATR < EMA(10): Suggests reduced volatility, signaling potential consolidation or sideways price action.
Parameters:
atrLength (Default: 5):
The number of bars used to calculate the ATR. A shorter period (e.g., 3-5) responds faster to price changes, while a longer period (e.g., 10-14) provides smoother results.
multiplier (Default: 1.8):
Controls the sensitivity of the filter. A lower multiplier (e.g., 1.5) filters out more bars, resulting in smoother ATR. Higher values (e.g., 2.0) allow more bars to pass through, retaining more price volatility.
maxIterations (Default: 20):
The maximum number of bars processed to detect abnormal values. Increasing this may improve accuracy at the cost of performance.
ema10Period (Default: 10):
The period for the Exponential Moving Average applied to the filtered ATR. Shorter periods provide faster signals, while longer periods give smoother, lagging signals.
Trading Strategies:
1. Breakout Strategy:
When filtered ATR crosses above EMA(10):
Enter long positions when price breaks above a key resistance level.
Higher volatility suggests strong price action and momentum.
When filtered ATR drops below EMA(10):
Exit positions or tighten stop-loss orders as volatility decreases.
Lower volatility may indicate consolidation or trend exhaustion.
2. Trend Following Strategy:
Use the filtered ATR line to track overall volatility.
If filtered ATR consistently stays above EMA: Hold positions or add to trades.
If filtered ATR remains below EMA: Reduce position size or stay out of trades.
3. Mean Reversion Strategy:
When filtered ATR spikes significantly above EMA, it may indicate market overreaction.
Look for price to revert to the mean once ATR returns below the EMA.
4. Stop-Loss Adjustment:
As volatility increases (ATR above EMA), widen stop-loss levels to avoid being stopped out by random fluctuations.
In low volatility (ATR below EMA), tighten stop-losses to minimize losses during low activity periods.
Benefits:
Reduced Noise: By filtering abnormal bars, the indicator provides cleaner signals.
Better Trend Detection: EMA smoothing highlights volatility trends.
Adaptable: The indicator can be customized for scalping, day trading, or swing trading.
Intuitive Visualization: Traders can visually see volatility shifts and adjust strategies in real-time.
Best Practices:
Timeframes: Works effectively on all timeframes, but higher timeframes (e.g., 1H, 4H, Daily) yield more reliable signals.
Markets: Suitable for forex, crypto, stocks, and commodities.
Combining Indicators: Use in combination with RSI, Moving Averages, Bollinger Bands, or price action analysis for stronger signals.
How It Works (Under the Hood):
The script calculates the Daily Range (High - Low) for each bar.
The largest and smallest bars are filtered out if their difference exceeds the multiplier (default 1.8).
The remaining bars are averaged to generate the filtered ATR.
An EMA(10) is then applied to the filtered ATR for smoother visualization.

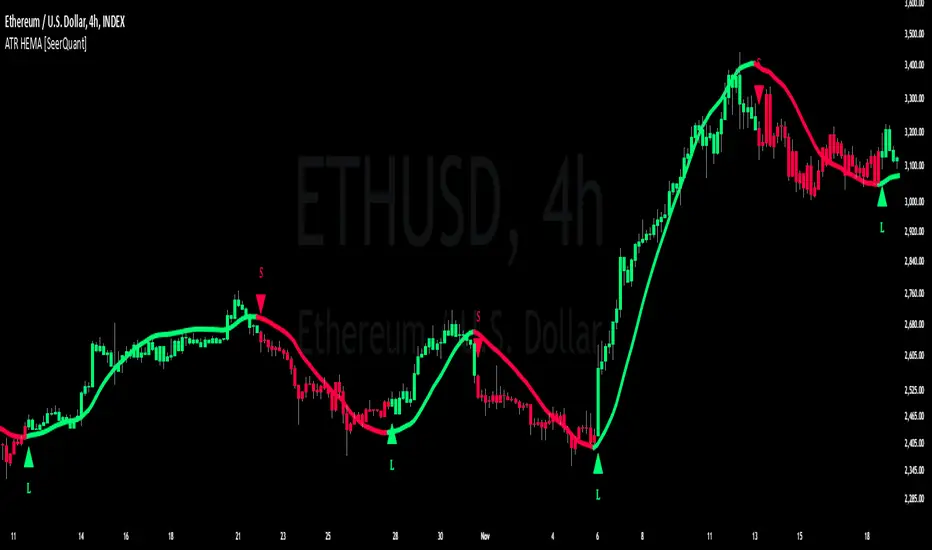
ATR HEMA [SeerQuant]What is the ATR Holt Moving Average (HEMA)?
The ATR Holt Moving Average (HEMA) is an advanced smoothing technique that incorporates the Holt exponential smoothing method. Unlike traditional moving averages, HEMA uses two smoothing factors (alpha and gamma) to forecast both the current trend and the trend change rate. This dual-layer approach improves the responsiveness of the moving average to both stable trends and volatile price swings.
When paired with the Average True Range (ATR), the HEMA becomes even more powerful. The ATR acts as a volatility filter, defining a "neutral zone" where minor price fluctuations are ignored. This allows traders to focus on significant market movements while reducing the impact of noise.
⚙️ How the Code Works
The ATR Holt Moving Average (HEMA) combines trend smoothing with volatility filtering to provide traders with dynamic signals. Here's how it functions step by step:
User Inputs and Customization:
Traders can customize the lengths for HEMA's smoothing factors (alphaL and gammaL), the ATR calculation length, and the neutral zone multiplier (atrMult).
The src input allows users to choose the price source for calculations (e.g., hl2), while the col input offers various color themes (Default, Modern, Warm, Cool).
Holt Exponential Moving Average (HEMA) Calculation:
Alpha and Gamma Smoothing Factors:
alpha controls how much weight is given to the current price versus past prices.
gamma smooths the trend change rate, reducing noise. The HEMA formula combines the current price, the previous HEMA value, and a trend adjustment (via the b variable) to create a smooth yet responsive average. The b variable tracks the rate of change in the HEMA over time, further refining the trend detection.
ATR-Based Neutral Zone:
If the change in HEMA (hemaChange) falls within the neutral zone, it is considered insignificant, and the trend color remains unchanged.
Color and Signal Detection:
Bullish Trend: The color is set to bull when HEMA rises above the neutral zone.
Bearish Trend: The color is set to bear when HEMA falls below the neutral zone.
Neutral Zone: The color remains unchanged, signalling no significant trend.
🚀 Summary
This indicator enhances traditional moving averages by combining the Holt smoothing method with ATR-based volatility filtering. The HEMA adapts to market conditions, detecting trends and transitions while filtering out insignificant price changes. The result is a versatile tool for:
The ATR Holt Moving Average (HEMA) is ideal for traders seeking a balance between responsiveness and stability, offering precise signals in both trending and volatile markets.
📜 Disclaimer
The information provided by this script is for educational and informational purposes only and does not constitute financial, investment, or trading advice. Past performance of any trading system or indicator, including this one, is not indicative of future results. Trading and investing in financial markets involve risk, and it is possible to lose your entire investment.
Users are advised to perform their own due diligence and consult with a licensed financial advisor before making any trading or investment decisions. The creator of this script is not responsible for any trading or investment decisions made based on the use of this script.
This script complies with TradingView's guidelines and is provided as-is, without any guarantee of accuracy, reliability, or performance. Use at your own risk.
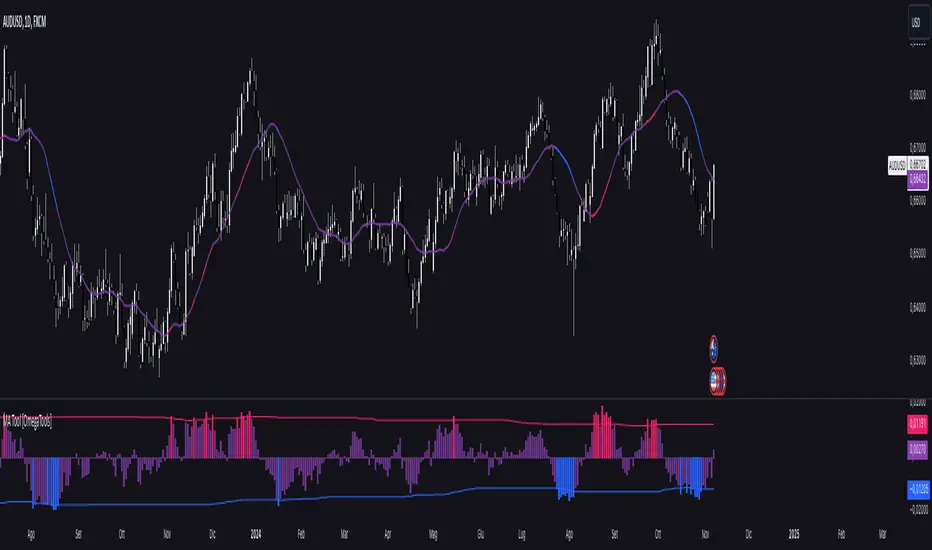
Moving Average Simple Tool [OmegaTools]This TradingView script is a versatile Moving Average Tool that offers users multiple moving average types and a customizable overbought and oversold (OB/OS) sensitivity feature. It is designed to assist in identifying potential price trends, reversals, and momentum by using different average calculations and providing visual indicators for deviation levels. Below is a detailed breakdown of the settings, functionality, and visual elements within the Moving Average Simple Tool.
Indicator Overview
Indicator Name: Moving Average Simple Tool
Short Title: MA Tool
Purpose: Provides a choice of six moving average types with configurable sensitivity, which helps traders identify trend direction, potential reversal zones, and overbought or oversold conditions.
Input Parameters
Source (src): This option allows the user to select the data source for the moving average calculation. By default, it is set to close, but users can choose other options like open, high, low, or any custom price data.
Length (lnt): Defines the period length for the moving average. By default, it is set to 21 periods, allowing users to adjust the moving average sensitivity to either shorter or longer periods.
Average Type (mode): This input defines the moving average calculation type. Six types of averages are available:
SMA (Simple Moving Average)
EMA (Exponential Moving Average)
WMA (Weighted Moving Average)
VWMA (Volume-Weighted Moving Average)
RMA (Rolling Moving Average)
Middle Line: Calculates the average between the highest and lowest price over the period specified in Length. This is useful for a mid-range line rather than a traditional moving average.
Sensitivity (sens): This parameter controls the sensitivity of the overbought and oversold levels. The sensitivity value can range from 1 to 40, where a lower value represents a higher sensitivity and a higher value allows for smoother OB/OS zones.
Color Settings:
OS (Oversold Color, upc): The color applied to deviation areas that fall below the oversold threshold.
OB (Overbought Color, dnc): The color applied to deviation areas that exceed the overbought threshold.
Middle Line Color (midc): A gradient color that visually blends between overbought and oversold colors for smoother visual transitions.
Calculation Components
Moving Average Calculation (mu): Based on the chosen Average Type, this calculation derives the moving average or middle line value for the selected source and length.
Deviation (dev): The deviation of the source value from the moving average is calculated. This is useful to determine whether the current price is significantly above or below the average, signaling potential buying or selling opportunities.
Overbought (ob) and Oversold (os) Levels: These levels are calculated using a linear percentile interpolation based on the deviation, length, and sensitivity inputs. The higher the sensitivity, the narrower the overbought and oversold zones, allowing users to capture more frequent signals.
Visual Elements
Moving Average Line (mu): This line represents the moving average based on the selected calculation method and is plotted with a dynamic color based on deviation thresholds. When the deviation crosses into overbought or oversold zones, it shifts to the corresponding OB/OS colors, providing a visual indication of potential trend reversals.
Deviation Plot (dev): This plot visualizes the deviation values as a column plot, with colors matching the overbought, oversold, or neutral states. This helps users to quickly assess whether the price is trending or reverting back to its mean.
Overbought (ob) and Oversold (os) Levels: These levels are plotted as fixed lines, helping users identify when the deviation crosses into overbought or oversold zones.
Mean Trend OscillatorMean Trend Oscillator
The Mean Trend Oscillator offers an original approach to trend analysis by integrating multiple technical indicators, using statistic to get a probable signal, and dynamically adapting to market volatility.
This tool aggregates signals from four popular indicators—Relative Strength Index (RSI), Simple Moving Average (SMA), Exponential Moving Average (EMA), and Relative Moving Average (RMA)—and adjusts thresholds using the Average True Range (ATR). By using this, we can use Statistics to aggregate or take the average of each indicators signal. Mathematically, Taking an average of these indicators gives us a better probability on entering a trending state.
By consolidating these distinct perspectives, the Mean Trend Oscillator provides a comprehensive view of market direction, helping traders make informed decisions based on a broad, data-driven trend assessment. Traders can use this indicator to enter long spot or leveraged positions. The Mean Trend Oscillator is intended to be use in long term trending markets. Scalping MUST NOT be used with this indicator. (This indicator will give false signals when the Timeframe is too low. The best intended use for high-quality signals are longer timeframes).
The current price of a beginning trend series may tell us something about the next move. Thus, the Mean Trend Oscillator allows us to spot a high probability trending market and potentially exploit this information enter long or shorts strategy. (again, this indicator will give false signals when the Timeframe is too low. The best intended use for high-quality signals are longer timeframes).
Concept and Calculation and Inputs
The Mean Trend Oscillator calculates a “net trend” score as follows:
RSI evaluates market momentum, identifying overbought and oversold conditions, essential for confirming trend direction.
SMA, EMA, and RMA introduce varied smoothing methods to capture short- to medium-term trends, balancing quick price changes with smoothed averages.
ATR-Enhanced Thresholds: ATR is used as a dynamic multiplier, adjusting each indicator’s thresholds to current volatility levels, which helps reduce noise in low-volatility conditions and emphasizes significant signals when volatility spikes.
Length could be used to adjust how quickly each indicator can more or how slower each indicator can be.
Time Coherency for Inputs: Each indicator must be calculated where each signal is relatively around the same area.
For example:
Simply:
SMA, RMA, EMA, and RSI enters long around each intended trend period. Doesn't have to be perfect, but the indicators all enter long around there.
Each indicator contributes a score (+1 for bullish and -1 for bearish), and these scores are averaged to generate the final trend score:
A positive score, shown as a green line, suggests bullish conditions.
A negative score, indicated by a red line, signifies bearish conditions.
Thus, giving us a signal to long or short.
How to Use the Mean Trend Oscillator
This indicator’s output is straightforward and can fit into various trading strategies:
Bullish Signal: A green line shows that the trend is bullish, based on a positive average score across the indicators, signaling a consideration of longing an asset.
Bearish Signal: A red line indicates bearish conditions, with an overall negative trend score, signaling a consideration to shorting an asset.
By aggregating these indicators, the Mean Trend Oscillator helps traders identify strong trends while filtering out minor fluctuations, making it a versatile tool for both short- and long-term analysis. This multi-layered, adaptive approach to trend detection sets it apart from traditional single-indicator trend tools.

Volumatic Variable Index Dynamic Average [BigBeluga]The Volumatic VIDYA (Variable Index Dynamic Average) indicator is a trend-following tool that calculates and visualizes both the current trend and the corresponding buy and sell pressure within each trend phase. Using the Variable Index Dynamic Average as the core smoothing technique, this indicator also plots volume levels of lows and highs based on market structure pivot points, providing traders with key insights into price and volume dynamics.
Additionally, it generates delta volume values to help traders evaluate buy-sell pressure balance during each trend, making it a powerful tool for understanding market sentiment shifts.
BTC:
TSLA:
🔵 IDEA
The Volumatic VIDYA indicator's core idea is to provide a dynamic, adaptive smoothing tool that identifies trends while simultaneously calculating the volume pressure behind them. The VIDYA line, based on the Variable Index Dynamic Average, adjusts according to the strength of the price movements, offering a more adaptive response to the market compared to standard moving averages.
By calculating and displaying the buy and sell volume pressure throughout each trend, the indicator provides traders with key insights into market participation. The horizontal lines drawn from the highs and lows of market structure pivots give additional clarity on support and resistance levels, backed by average volume at these points. This dual analysis of trend and volume allows traders to evaluate the strength and potential of market movements more effectively.
🔵 KEY FEATURES & USAGE
VIDYA Calculation:
The Variable Index Dynamic Average (VIDYA) is a special type of moving average that adjusts dynamically to the market’s volatility and momentum. Unlike traditional moving averages that use fixed periods, VIDYA adjusts its smoothing factor based on the relative strength of the price movements, using the Chande Momentum Oscillator (CMO) to capture the magnitude of price changes. When momentum is strong, VIDYA adapts and smooths out price movements quicker, making it more responsive to rapid price changes. This makes VIDYA more adaptable to volatile markets compared to traditional moving averages such as the Simple Moving Average (SMA) or the Exponential Moving Average (EMA), which are less flexible.
// VIDYA (Variable Index Dynamic Average) function
vidya_calc(src, vidya_length, vidya_momentum) =>
float momentum = ta.change(src)
float sum_pos_momentum = math.sum((momentum >= 0) ? momentum : 0.0, vidya_momentum)
float sum_neg_momentum = math.sum((momentum >= 0) ? 0.0 : -momentum, vidya_momentum)
float abs_cmo = math.abs(100 * (sum_pos_momentum - sum_neg_momentum) / (sum_pos_momentum + sum_neg_momentum))
float alpha = 2 / (vidya_length + 1)
var float vidya_value = 0.0
vidya_value := alpha * abs_cmo / 100 * src + (1 - alpha * abs_cmo / 100) * nz(vidya_value )
ta.sma(vidya_value, 15)
When momentum is strong, VIDYA adapts and smooths out price movements quicker, making it more responsive to rapid price changes. This makes VIDYA more adaptable to volatile markets compared to traditional moving averages
Triangle Trend Shift Signals:
The indicator marks trend shifts with up and down triangles, signaling a potential change in direction. These signals appear when the price crosses above a VIDYA during an uptrend or crosses below during a downtrend.
Volume Pressure Calculation:
The Volumatic VIDYA tracks the buy and sell pressure during each trend, calculating the cumulative volume for up and down bars. Positive delta volume occurs during uptrends due to higher buy pressure, while negative delta volume reflects higher sell pressure during downtrends. The delta is displayed in real-time on the chart, offering a quick view of volume imbalances.
Market Structure Pivot Lines with Volume Labels:
The indicator draws horizontal lines based on market structure pivots, which are calculated using the highs and lows of price action. These lines are extended on the chart until price crosses them. The indicator also plots the average volume over a 6-bar range to provide a clearer understanding of volume dynamics at critical points.
🔵 CUSTOMIZATION
VIDYA Length & Momentum: Control the sensitivity of the VIDYA line by adjusting the length and momentum settings, allowing traders to customize the smoothing effect to match their trading style.
Volume Pivot Detection: Set the number of bars to consider for identifying pivots, which influences the calculation of the average volume at key levels.
Band Distance: Adjust the band distance multiplier for controlling how far the upper and lower bands extend from the VIDYA line, based on the ATR (Average True Range).

RSI with Swing Trade by Kelvin_VAlgorithm Description: "RSI with Swing Trade by Kelvin_V"
1. Introduction:
This algorithm uses the RSI (Relative Strength Index) and optional Moving Averages (MA) to detect potential uptrends and downtrends in the market. The key feature of this script is that it visually changes the candle colors based on the market conditions, making it easier for users to identify potential trend swings or wave patterns.
The strategy offers flexibility by allowing users to enable or disable the MA condition. When the MA condition is enabled, the strategy will confirm trends using two moving averages. When disabled, the strategy will only use RSI to detect potential market swings.
2. Key Features of the Algorithm:
RSI (Relative Strength Index):
The RSI is used to identify potential market turning points based on overbought and oversold conditions.
When the RSI exceeds a predefined upper threshold (e.g., 60), it suggests a potential uptrend.
When the RSI drops below a lower threshold (e.g., 40), it suggests a potential downtrend.
Moving Averages (MA) - Optional:
Two Moving Averages (Short MA and Long MA) are used to confirm trends.
If the Short MA crosses above the Long MA, it indicates an uptrend.
If the Short MA crosses below the Long MA, it indicates a downtrend.
Users have the option to enable or disable this MA condition.
Visual Candle Coloring:
Green candles represent a potential uptrend, indicating a bullish move based on RSI (and MA if enabled).
Red candles represent a potential downtrend, indicating a bearish move based on RSI (and MA if enabled).
3. How the Algorithm Works:
RSI Levels:
The user can set RSI upper and lower bands to represent potential overbought and oversold levels. For example:
RSI > 60: Indicates a potential uptrend (bullish move).
RSI < 40: Indicates a potential downtrend (bearish move).
Optional MA Condition:
The algorithm also allows the user to apply the MA condition to further confirm the trend:
Short MA > Long MA: Confirms an uptrend, reinforcing a bullish signal.
Short MA < Long MA: Confirms a downtrend, reinforcing a bearish signal.
This condition can be disabled, allowing the user to focus solely on RSI signals if desired.
Swing Trade Logic:
Uptrend: If the RSI exceeds the upper threshold (e.g., 60) and (optionally) the Short MA is above the Long MA, the candles will turn green to signal a potential uptrend.
Downtrend: If the RSI falls below the lower threshold (e.g., 40) and (optionally) the Short MA is below the Long MA, the candles will turn red to signal a potential downtrend.
Visual Representation:
The candle colors change dynamically based on the RSI values and moving average conditions, making it easier for traders to visually identify potential trend swings or wave patterns without relying on complex chart analysis.
4. User Customization:
The algorithm provides multiple customization options:
RSI Length: Users can adjust the period for RSI calculation (default is 4).
RSI Upper Band (Potential Uptrend): Users can customize the upper RSI level (default is 60) to indicate a potential bullish move.
RSI Lower Band (Potential Downtrend): Users can customize the lower RSI level (default is 40) to indicate a potential bearish move.
MA Type: Users can choose between SMA (Simple Moving Average) and EMA (Exponential Moving Average) for moving average calculations.
Enable/Disable MA Condition: Users can toggle the MA condition on or off, depending on whether they want to add moving averages to the trend confirmation process.
5. Benefits of the Algorithm:
Easy Identification of Trends: By changing candle colors based on RSI and MA conditions, the algorithm makes it easy for users to visually detect potential trend reversals and trend swings.
Flexible Conditions: The user has full control over the RSI and MA settings, allowing them to adapt the strategy to different market conditions and timeframes.
Clear Visualization: With the candle color changes, users can quickly recognize when a potential uptrend or downtrend is forming, enabling faster decision-making in their trading.
6. Example Usage:
Day traders: Can apply this strategy on short timeframes such as 5 minutes or 15 minutes to detect quick trends or reversals.
Swing traders: Can use this strategy on longer timeframes like 1 hour or 4 hours to identify and follow larger market swings.

MTF Candle Multi HubMTF Candle Multi Hub Indicator - Guide 日本語解説は下記
Introduction
The "MTF Candle Multi Hub" indicator is a versatile and comprehensive tool designed to visualize multiple timeframes' candlestick data, Heikin Ashi candles, and moving averages on a single chart. This indicator also includes a Zigzag feature with the ability to draw horizontal lines at significant swing points, making it a powerful tool for technical analysis.
Key Features
Multi-Timeframe Candlestick Display:
The indicator allows you to display candlesticks from different timeframes, including 5-minute, 15-minute, 1-hour, 4-hour, daily, and weekly timeframes.
Each timeframe's candlestick can be toggled on or off using the settings panel.
Candlesticks are color-coded based on whether the close is higher or lower than the open, with customizable colors for bullish and bearish candles.
Heikin Ashi Candlesticks:
Heikin Ashi candlesticks are also available for 5-minute, 15-minute, 1-hour, 4-hour, daily, and weekly timeframes.
Like the standard candlesticks, these can be toggled on or off, and their colors are customizable.
Moving Averages (MA):
The indicator supports up to four different moving averages, which can be either Simple Moving Average (SMA) or Exponential Moving Average (EMA).
The user can toggle each moving average on or off and adjust the period and type from the settings panel.
An additional feature allows the space between two moving averages to be filled with a color, indicating the relative position of the MAs.
Zigzag Indicator with Horizontal Lines:
The Zigzag feature plots lines between significant swing highs and lows, helping identify trends and potential reversal points.
Two Zigzag lines can be configured, each with customizable swing length, line color, style, and width.
The indicator also offers the ability to draw horizontal lines at the start and end of each Zigzag swing. These horizontal lines can be customized in terms of color, style, width, and length.
The number of horizontal lines to be drawn can be set, allowing for focused analysis of the most recent swings.
Label and Comment Display:
The indicator provides the option to display custom labels and comments on the chart.
You can enter up to ten different comments, which will be displayed in a label at the last candlestick of the chart.
The label's position, background color, text color, and text size are fully customizable.
Trading Strategy
Trend Following with Multi-Timeframe Analysis:
Use the multi-timeframe candlestick and Heikin Ashi features to assess the trend across different timeframes. For example, if both the daily and 4-hour Heikin Ashi candles are bullish, it may indicate a strong uptrend.
Entry and Exit Signals:
Use the Zigzag indicator to identify potential entry points by looking for a new swing high or low.
Horizontal lines from the Zigzag can be used as support and resistance levels, helping to determine potential entry and exit points.
Moving Average Crossovers:
Monitor the crossovers of the moving averages. For example, when a shorter-term MA crosses above a longer-term MA, it may signal a potential buy opportunity.
Confluence of Signals:
The best trading opportunities may arise when multiple signals align. For example, a bullish Zigzag swing, supported by bullish Heikin Ashi candles and a moving average crossover, could provide a strong buy signal.
Disclaimer
For Educational Purposes Only: This indicator is provided for educational purposes and should not be used as the sole basis for any trading decisions.
No Guarantees: The indicator is provided "as is" without any guarantees of accuracy or completeness. Market conditions can change rapidly, and this indicator may not always reflect the most accurate market state.
Test Thoroughly: Bugs may exist in the script. It is highly recommended to test this script on a demo account before using it in live trading.
Use with Caution: Always use this indicator in conjunction with other analysis tools. Do not rely solely on this indicator for making trading decisions.
Sudden Changes or Removal: The indicator may be subject to sudden changes or removal without prior notice. The developer is not responsible for any issues this may cause.
By using this indicator, you agree to these terms.
MTF Candle Multi Hub インジケーター - ガイド
はじめに
「MTF Candle Multi Hub」インジケーターは、複数の時間枠のローソク足データ、平均足、移動平均線を1つのチャート上で視覚化するために設計された多用途かつ包括的なツールです。このインジケーターには、水平線を描画する機能を備えたジグザグ機能も含まれており、テクニカル分析において強力なツールとなります。
主な機能
マルチタイムフレームのローソク足表示:
5分足、15分足、1時間足、4時間足、日足、週足のローソク足を表示することができます。
各時間枠のローソク足は設定パネルでオンまたはオフに切り替えることができます。
ローソク足は、終値が始値より高いか低いかに基づいて色分けされており、強気と弱気のローソク足の色をカスタマイズできます。
平均足ローソク足:
5分足、15分足、1時間足、4時間足、日足、週足の平均足ローソク足を表示することができます。
標準のローソク足と同様に、これらをオンまたはオフに切り替え、色をカスタマイズすることが可能です。
移動平均線(MA):
このインジケーターは、単純移動平均線(SMA)または指数移動平均線(EMA)のいずれかを選択できる4つの移動平均線をサポートしています。
各移動平均線をオンまたはオフに切り替え、期間やタイプを設定パネルから調整できます。
また、2本の移動平均線の間に色を塗ることで、MAの相対的な位置を視覚的に表示する機能もあります。
ジグザグインジケーターと水平線:
ジグザグ機能は、重要なスイングの高値と安値の間に線を引き、トレンドや潜在的な反転ポイントを識別するのに役立ちます。
2本のジグザグラインを設定することができ、それぞれのスイングの長さ、線の色、スタイル、幅をカスタマイズできます。
また、ジグザグのスイングの始点と終点に水平線を描画する機能も提供されています。これらの水平線は、色、スタイル、幅、長さをカスタマイズできます。
描画する水平線の本数を設定でき、最新のスイングに焦点を当てた分析が可能です。
ラベルとコメントの表示:
インジケーターは、チャート上にカスタムラベルとコメントを表示するオプションを提供します。
最大10個の異なるコメントを入力することができ、これらはチャートの最新のローソク足にラベルとして表示されます。
ラベルの位置、背景色、テキストの色、テキストのサイズは完全にカスタマイズ可能です。
トレード戦略
マルチタイムフレーム分析を使用したトレンドフォロー:
マルチタイムフレームのローソク足や平均足の機能を使用して、異なる時間枠でのトレンドを評価します。例えば、日足と4時間足の平均足が共に強気であれば、強い上昇トレンドを示している可能性があります。
エントリーとエグジットシグナル:
ジグザグインジケーターを使用して、新たなスイング高値または安値を確認し、エントリーポイントを見極めます。
ジグザグの水平線をサポートおよびレジスタンスレベルとして使用し、エントリーやエグジットのタイミングを判断します。
移動平均線のクロスオーバー:
移動平均線のクロスオーバーを監視します。例えば、短期の移動平均線が長期の移動平均線を上抜けた場合、買いのシグナルとなる可能性があります。
シグナルのコンフルエンス:
複数のシグナルが一致する場合、最も良いトレード機会が生まれるかもしれません。例えば、強気のジグザグスイング、強気の平均足、移動平均線のクロスオーバーが揃うと、強力な買いシグナルとなる可能性があります。
免責事項
教育目的のみ: このインジケーターは教育目的で提供されており、トレードの決定を行う際の唯一の基準として使用すべきではありません。
保証なし: インジケーターは「現状のまま」提供されており、その正確性や完全性についての保証はありません。市場の状況は急速に変化する可能性があり、このインジケーターが常に最も正確な市場状況を反映するとは限りません。
十分なテストを: このスクリプトにはバグが存在する可能性があります。実際のトレードで使用する前に、デモ口座で十分にテストすることを強くお勧めします。
慎重に使用: このインジケーターを他の分析ツールと併用して使用してください。このインジケーターだけに頼ってトレードの決定を行うべきではありません。
突然の変更や削除の可能性: このインジケーターは予告なく変更や削除が行われる場合があります。そのため、利用者に不利益が生じる可能性がありますが、開発者はその責任を負いません。
このインジケーターを使用することで、これらの条件に同意したものとみなされます。

GL LineIntroduction
The GL Line Indicator is a versatile tool designed to assist traders in identifying market trends by utilizing three different types of moving averages (EMA, SMA, VWMA) across multiple timeframes. This indicator provides a comprehensive view of market conditions, making it easier to spot potential trading opportunities.
Features
Multiple Moving Average Types:
Choose between Exponential Moving Average (EMA), Simple Moving Average (SMA), and Volume Weighted Moving Average (VWMA) for more tailored analysis.
Triple Timeframe Analysis:
Analyze trends across three different timeframes (Main, Secondary, Tertiary) to get a clearer picture of market direction.
Configurable Parameters:
Customizable lengths for fast and slow-moving averages. Adjustable ATR length and multiplier to refine trend detection sensitivity.
Visual Trend Indication:
Bullish and bearish trends are marked with color-coded lines and fills, enhancing visual clarity.
Confluence Table:
Optional confluence table that shows trend direction across the selected timeframes, aiding in decision-making.
How It Works
Main Trend Calculation:
Select the type of moving average and set the lengths for fast and slow MAs. The difference between these MAs, adjusted by the ATR multiplier, determines the trend direction.
Secondary and Tertiary Trends:
Similar calculations are done for secondary and tertiary timeframes, providing a broader market overview.
Trend Direction and Plotting:
The indicator plots the moving averages and fills the area between them with colors to denote bullish (green) and bearish (red) trends.
How to Use
Select Moving Average Type:
Choose between EMA, SMA, or VWMA based on your trading strategy.
Set Lengths and Multipliers:
Customize the lengths for the fast and slow-moving averages and adjust the ATR length and multiplier for better trend sensitivity.
Analyze Trends:
Use the color-coded plots and fills to identify market trends and make informed trading decisions.
Check Confluence Table:
Optionally display the confluence table to see trend directions across different timeframes.
Disclaimer
This indicator is designed to work best when the secondary and tertiary trends are set to higher timeframes than the chart's timeframe. Using higher timeframes for additional trends provides a broader market perspective and enhances the reliability of trend signals.

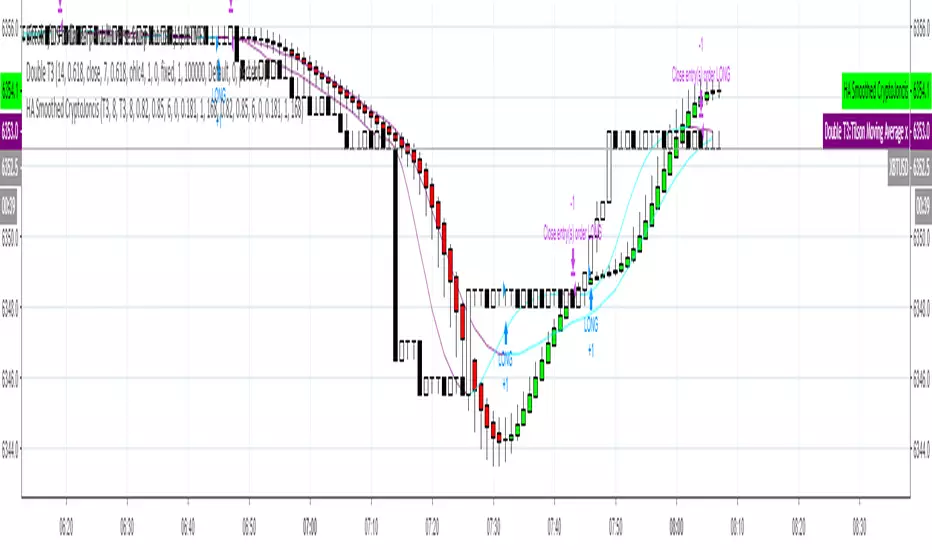
Six T3 Bands – Set to Any Time Frame [1000X]Script Description: Six T3 Bands – Set to Any Time Frame
This script leverages T3 lines, an advanced form of moving averages, to provide more adaptive and responsive indicators compared to traditional Moving Averages (MA) or Exponential Moving Averages (EMA). The T3 indicator, originally conceptualized by Tim Tillson in 1998, is known for its smoothness and reduced lag, making it a powerful tool for traders seeking precise market signals.
Features:
1 Adjustable Parameters:
◦ The script allows for the customization of six different T3 lines, each with adjustable lengths and "b values" (smoothing coefficients). This flexibility lets users fine-tune the indicators to fit various trading styles and market conditions.
◦ Users can set the reference timeframe for the T3 lines using the request.security function, enabling analysis across different timeframes. By default, the timeframe is set to the daily chart.
2 Calculation Method:
◦ The T3 lines are calculated using a multi-stage Exponential Moving Average (EMA) process. Specifically, the price data is smoothed through six stages of EMA calculations, with coefficients applied to produce the final T3 value. This method ensures the T3 lines are smoother and less laggy than traditional moving averages.
3 Usage:
◦ The T3 lines can be utilized to identify natural support and resistance levels within the market. By observing how the price interacts with these lines, traders can gain insights into potential reversal points or continuation patterns.
◦ The script's default settings are optimized for identifying these levels, but users are encouraged to adjust the parameters to match their specific trading strategies.
How to Use:
1 Customization:
◦ Access the script's settings to adjust the T3 lengths and "b values" for each of the six lines. This customization allows you to tailor the indicator to your preferred sensitivity and responsiveness.
◦ Set the reference timeframe according to your analysis needs. Whether you prefer intraday, daily, or longer-term charts, the T3 lines will remain set to the reference timeframe that you choose, while you focus your attention on the time frame of your choice.
2 Trading Strategies:
◦ Support and Resistance Trading: Use the T3 lines to identify key support and resistance zones. Look for price reactions around these lines to make informed trading decisions.
◦ Trend Confirmation: Combine the T3 lines with other technical indicators to confirm trends and filter out noise. The smoothness of the T3 lines helps in recognizing genuine trend changes.
Conclusion: This script builds on the foundational work of Tim Tillson and the classic T3 Average script by @HPotter (2014). Significant enhancements include making the "b value" an adjustable input and utilizing the request.security function to apply T3 lines to a specified timeframe. These improvements provide traders with greater control and adaptability, enhancing the practical utility of the T3 indicator.
The "Six T3 Bands – Set to Any Time Frame " script offers a useful tool for traders looking to enhance their technical analysis, both to visualize trend direction and to identify likely support and resistance levels. Its adaptive nature and customizable features make it a valuable addition to many trading strategies..

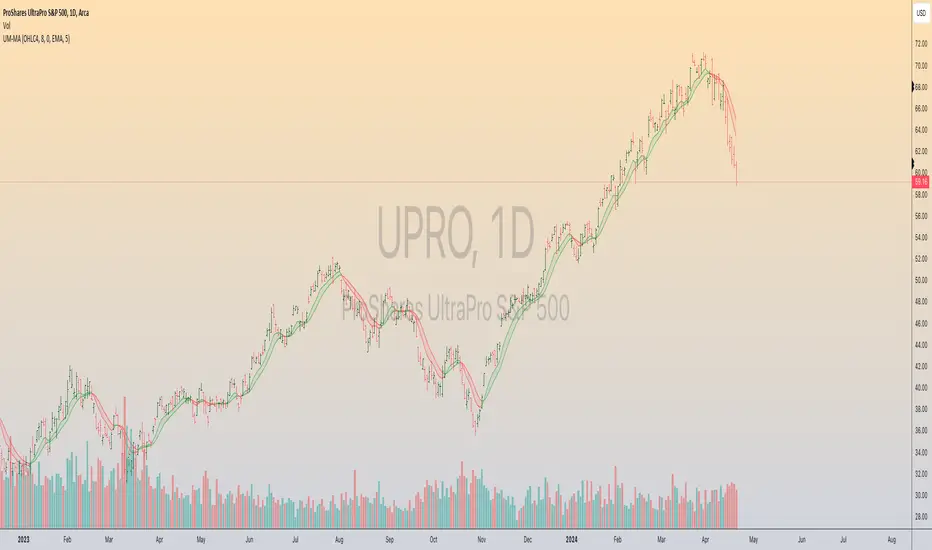
UM-MA-Directional-Colors
UM-MA-DIRECTION Indicator
Indicator Description
The UM-MA-Direction indicator adds a few more features to a traditional Moving Average indicator. The primary difference is color change upon MA direction. The indicator is green when trending higher and red when trending lower. Additionally, a MA of the MA can be configured. This gives a smoothing effect of the indicator. The indicator also includes a fill between the configured moving average and the moving average of the moving average.
User Configuration
All parameters and colors are user-configurable. While the default is an EMA (Exponential Moving Average), of 8 with a EMA of the EMA set to 5, both can be configured or disabled to the user's liking. The default trending and fill colors are red for trending lower and green for trending higher. The type of MA used is also user configurable with EMA - Exponential Moving Average set as the default.
Alerts
Alerts can be set for Bullish (red to green) color changes or Bearish (green to red) color changes by right-clicking the indicator and selecting "Add Alert."
Recommended Usage
Use this indicator to better determine trend direction over traditional Moving Averages. If you use several MAs, add this indicator to the chart as many times as you like with different settings and configurations.
Author Recommended Settings
I use an 8 period EMA with a 5 period EMA of the EMA on daily and hourly charts. I also use the 233 EMA with no fill and no EMA of EMA on the 3 minute chart. Both 8 and 233 are Fibonacci numbers in case you are wondering. I have also observed there is a fractal nature (recurring pattern within a recurring pattern) to the EMAs. An 8 period EMA color transition on the 1 hour chart is close to a 233 period color transition on the 3 minute chart as far as direction changes. The 233 EMA on the 3 minute chart was borrowed from the "Perfect Storm Trading" book by Wendy and Kim Kirkland which I highly recommend.
Liquidation Longs/Shorts [UAlgo]🔶Description:
The "Liquidation Longs/Shorts " indicator is designed to identify potential liquidation levels for long and short positions. It calculates the distance of the selected price source (close, high, low, or open) from two moving averages (MA) and plots the resulting values on the chart. When the price is at an extreme distance from the moving averages, it suggests a potential liquidation point for either long or short positions.
🔶Key Features:
Liquidation Calculations: The indicator calculates the distance of the selected price source from two moving averages: a simple moving average (SMA) and an exponential moving average (EMA) with customizable lengths.
Color Customization: Users can customize the colors of the plotted columns representing the distance from the moving averages for long and short liquidation levels.
Liquidation Circles: The indicator marks potential liquidation levels with small circles on the chart, with customizable colors for long and short liquidations.
Orange Circles -> Identifies Potential Short Liquidations
Aqua Circles -> Identifies Potential Long Liquidations
Example:
Adaptive Source Selection: Traders can select the price source (close, high, low, or open) for liquidation calculations, allowing flexibility based on their trading strategies.
Dynamic Threshold Calculation: The indicator dynamically adjusts the liquidation threshold based on the selected moving average lengths, providing adaptability to changing market conditions.
Disclaimer:
Use with Caution: This indicator is provided for educational purposes only and should not be considered as financial advice. Users should exercise caution and perform their own analysis before making trading decisions based on the indicator's signals.
Not Financial Advice: The information provided by this indicator does not constitute financial advice, and the creator (UAlgo) shall not be held responsible for any trading losses incurred as a result of using this indicator.
Backtesting Recommended: Traders are encouraged to backtest the indicator thoroughly on historical data before using it in live trading to assess its performance and suitability for their trading strategies.
Risk Management: Trading involves inherent risks, and users should implement proper risk management strategies, including but not limited to stop-loss orders and position sizing, to mitigate potential losses.
No Guarantees: The accuracy and reliability of the indicator's signals cannot be guaranteed, as they are based on historical price data and past performance may not be indicative of future results.
This indicator serves as a tool to assist traders in identifying potential liquidation levels, but it should be used in conjunction with other technical analysis tools and risk management practices for effective trading decision-making.

No Wick Bull/Bear Candlesticks with Arrow premiumNo Wick Bull/Bear Candlesticks with Arrow premium
This script is for a custom trading indicator called "No Wick Bull/Bear Candlesticks with Arrow premium" developed by ClearTradingMind. It is designed for use with trading platforms that support scripting, such as TradingView. This indicator combines several technical analysis tools to help traders identify potential buy and sell signals in a financial market.
Key Components of the Indicator:
Moving Average (MA): The script allows users to select from various types of moving averages (SMA, EMA, HMA, etc.), which smooth out price data to identify trends. Users can set the length and type of the moving average.
Upper and Lower Bands: These bands are set at a specified deviation percentage above and below the chosen moving average. They help in identifying overbought and oversold conditions.
No Wick Bull/Bear Candlestick Identification:
Bullish Condition: A bullish candlestick is identified when the closing price is higher than the opening price, the low equals the open, and the close is above the moving average.
Bearish Condition: A bearish candlestick is identified when the closing price is lower than the opening price, the high equals the open, and the close is below the moving average.
No Wick: These conditions also imply that the candlesticks have no wicks, suggesting strong buying or selling pressure.
Arrows for Trading Signals:
No lower wick bull bar
No upper wick bear bar
When a bullish condition is met, a green upward-pointing triangle is plotted below the candlestick, indicating a potential buy signal.
When a bearish condition is met, a red downward-pointing triangle is plotted above the candlestick, indicating a potential sell signal.
EMA 20: An additional Exponential Moving Average with a length of 20 periods is plotted for further trend analysis.
Background Color Changes: The script changes the background color to blue if the EMA 20 is above the upper band, and to red if it is below the lower band, providing visual cues about the market trend.
How It Works:
Traders can input their preferences for the moving average type and length, source of the MA (like closing prices), and the deviation percentage for the bands.
The script then calculates the moving average, upper and lower bands, and checks for bullish or bearish candlestick conditions without wicks.
When such conditions are met, it plots arrows to suggest buy or sell signals.
The EMA 20 and background color changes offer additional trend information.
Usage:
This indicator is particularly useful in markets with clear trends. The no wick bull/bear candlesticks indicate strong buying or selling pressure, and the arrows provide clear visual signals for traders to consider entering or exiting positions. As with all trading indicators, it's recommended to use this tool in conjunction with other forms of analysis to confirm trading signals.

RVI_HTFThe "RVI_HTF" indicator is a tool designed to assist traders in analyzing market trends using the Relative Vigor Index (RVI) across different timeframes. It enables users to customize various aspects of the indicator's appearance and behavior. By monitoring the RVI on different timeframes, tracking its relationship with the moving average, and paying attention to extreme arrows above the 80 or below the 20 line, traders can anticipate potential reversals, trends, or changes in market momentum.
Above 80 Line: When the RVI moves above the 80 line, it suggests that the market may be overbought. Extreme upward arrows (indicating potential sell signals) can be a sign that a bullish trend might be reaching an exhaustion point. Traders may anticipate a possible trend reversal or pullback.
Below 20 Line: When the RVI dips below the 20 line, it implies that the market might be oversold. Extreme downward arrows (indicating potential buy signals) can be an early signal of a potential bullish reversal. Traders may anticipate an upcoming uptrend or bounce.
Crossing Above Moving Average: When the RVI crosses above its moving average on the selected timeframe, it can serve as an early indication of potential bullish strength in the market. This suggests that buying pressure may be increasing.
Crossing Below Moving Average: Conversely, when the RVI crosses below its moving average, it can signal potential bearish momentum. This indicates that selling pressure may be gaining strength.
Variables:
Timeframe (TF) Selection:
The indicator allows you to select the timeframe for the RVI calculation. You can choose from various options such as 1 minute (1), 5 minutes (5), 15 minutes (15), 30 minutes (30), 60 minutes (60), 240 minutes (240), Daily (D), Weekly (W), Monthly (M), or use "Auto" to automatically select a higher timeframe based on your current chart's timeframe.
Moving Average Type (MA_Type):
Function: Allows users to select the type of moving average used in RVI calculations.
Options: You can select from various moving average types, including:
SMA (Simple Moving Average)
EMA (Exponential Moving Average)
SMMA (Smoothed Moving Average, also known as RMA)
WMA (Weighted Moving Average)
VWMA (Volume Weighted Moving Average)
DEMA (Double Exponential Moving Average)
Moving Average Length (MA_Length):
Function: Permits users to set the number of periods for the selected moving average type.
Purpose: Controls the sensitivity of the RVI indicator. Longer lengths provide smoother results, while shorter lengths react more quickly to price changes.
Up Arrow Color (upArrowColor):
Function: Enables users to customize the color of arrows that indicate potential Overbought areas. (Only shown when the TF is same as or lower than the chart TF)
Down Arrow Color (downArrowColor):
Function: Allows users to specify the color of downward-pointing arrows signaling potential Oversold areas. (Only shown when the TF is same as or lower than the chart TF)
RVI Up Color (firstColor):
Function: Defines the color of the RVI line when it indicates a bullish condition on the higher timeframe.
RVI Down Color (secondColor):
Function: Specifies the color of the RVI line when it suggests a bearish condition on the higher timeframe.
RVI-Based Moving Average Up Color (firstColorMA):
Function: Customizes the color of the RVI-based moving average line when it indicates a bullish condition.
RVI-Based Moving Average Down Color (secondColorMA):
Function: Defines the color of the RVI-based moving average line when it suggests a bearish condition.

3kilos BTC 15mThe "3kilos BTC 15m" is a comprehensive trading strategy designed to work on a 15-minute timeframe for Bitcoin (BTC) or other cryptocurrencies. This strategy combines multiple indicators, including Triple Exponential Moving Averages (TEMA), Average True Range (ATR), and Heikin-Ashi candlesticks, to generate buy and sell signals. It also incorporates risk management features like take profit and stop loss.
Indicators
Triple Exponential Moving Averages (TEMA): Three TEMA lines are used with different lengths and sources:
Short TEMA (Red) based on highs
Long TEMA 1 (Blue) based on lows
Long TEMA 2 (Green) based on closing prices
Average True Range (ATR): Custom ATR calculation with EMA smoothing is used for volatility measurement.
Supertrend: Calculated using ATR and a multiplier to determine the trend direction.
Simple Moving Average (SMA): Applied to the short TEMA to smooth out its values.
Heikin-Ashi Close: Used for additional trend confirmation.
Entry & Exit Conditions
Long Entry: Triggered when the short TEMA is above both long TEMA lines, the Supertrend is bullish, the short TEMA is above its SMA, and the Heikin-Ashi close is higher than the previous close.
Short Entry: Triggered when the short TEMA is below both long TEMA lines, the Supertrend is bearish, the short TEMA is below its SMA, and the Heikin-Ashi close is lower than the previous close.
Take Profit and Stop Loss: Both are calculated as a percentage of the entry price, and they are set for both long and short positions.
Risk Management
Take Profit: Set at 1% above the entry price for long positions and 1% below for short positions.
Stop Loss: Set at 3% below the entry price for long positions and 3% above for short positions.
Commission and Pyramiding
Commission: A 0.07% commission is accounted for in the strategy.
Pyramiding: The strategy does not allow pyramiding.
Note
This strategy is designed for educational purposes and should not be considered as financial advice. Always do your own research and consider consulting a financial advisor before engaging in trading.

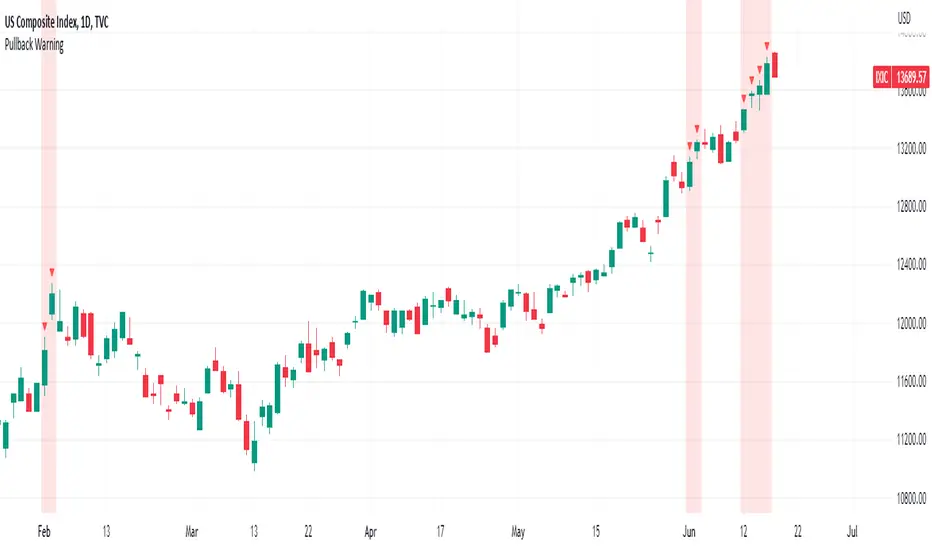
Pullback WarningThe Pullback Warning indicator is a simple indicator that highlights the potential for a market pullback, by measuring distances between certain key moving averages.
John Pocorobba recently shared in his general market updates, research showing that when the distance between the closing price and the 9 day exponential moving average is greater than the distance between the 9 day exponential moving average and the 20 day exponential moving average a pullback is likely.
While this condition occurs frequently, I added sensitivity options to try and filter out the noise. The sensitivity is based on the closing price’s extension from the 50 day simple moving average. Depending on your level of sensitivity, only signals that occur when price is extended either 5, 6, or 7 percent away from the 50 sma will be plotted.
Choose how to see the signal:
Highlight Background
Plot a symbol at desired location
Note this signal works best on indexes, not individual securities.
Custom Weighted Moving Average with SMA, EMA, and VWAPThe Custom Weighted Moving Average with SMA, EMA, and VWAP (CWMA-SMA-EMA-VWAP) is a versatile and comprehensive trading indicator that combines the strength of Simple Moving Averages (SMAs), Exponential Moving Averages (EMAs), and the Volume Weighted Average Price (VWAP) to create a custom weighted moving average. This indicator is designed to provide a more holistic view of the market and enhance trading decisions by considering multiple moving average types and their respective timeframes. The indicator also highlights intersections between the custom weighted moving average and the individual SMA, EMA, and VWAP lines by changing their color to yellow, which can be used as potential entry or exit signals.
How to Use:
The CWMA-SMA-EMA-VWAP indicator can be used in various ways to make informed trading decisions. Here are some possible strategies:
Trend Identification: The custom weighted moving average (CWMA) can act as a dynamic support and resistance level, smoothing out the price movements and revealing the underlying trend. When the price is above the CWMA, it may indicate an uptrend, and when it's below, a downtrend. Traders can use this information to align their trades with the prevailing market trend.
Crossovers: The intersections between the CWMA and individual SMA, EMA, and VWAP lines are highlighted in yellow, which can serve as potential entry or exit signals. For instance, when the price or one of the moving averages crosses above the CWMA, it may signal a bullish trend, and traders could consider entering a long position. Conversely, when the price or one of the moving averages crosses below the CWMA, it may signal a bearish trend, and traders could consider entering a short position.
Confirmation of Signals: The CWMA-SMA-EMA-VWAP indicator can be used in conjunction with other technical analysis tools to confirm or strengthen trading signals. For example, traders may use oscillators like the RSI or MACD to confirm overbought or oversold conditions and identify potential reversals in tandem with the CWMA-SMA-EMA-VWAP crossovers.
Stop Loss and Take Profit Levels: The CWMA, SMAs, EMAs, and VWAP lines can serve as dynamic support and resistance levels, helping traders set stop loss and take profit targets. For example, a trader might set a stop loss below the CWMA during an uptrend or above the CWMA during a downtrend. Similarly, they might set take profit targets near significant SMA or EMA levels, anticipating that the price may reverse or consolidate at these points.
It's important to note that the CWMA-SMA-EMA-VWAP indicator, like any other technical analysis tool, should not be used in isolation. Combining it with other technical analysis methods, proper risk management, and a well-defined trading plan will increase the chances of success in the market. Additionally, traders should backtest and validate any strategy using historical data before applying it to real-world trading.

Exponential Bollinger Bands (EBB)This script is a variation of the popular Bollinger Bands indicator, which uses exponential moving averages (EMA) instead of simple moving averages (SMA) as its core calculation. The indicator is designed to provide a visual representation of volatility, with the distance between the upper and lower bands being determined by the standard deviation of the underlying data.
The script starts by defining a number of helper functions that are used to calculate the moving averages and standard deviations required for the indicator. The first helper function is sma(), which calculates the simple moving average of the input data over a specified length. This function uses linear interpolation to smooth the data when the length is not an integer. The stdev() function calculates the standard deviation of the input data using the simple moving average calculated by the sma() function.
The bes() function calculates the exponential moving average of the input data over a specified length. The estdev() function calculates the standard deviation of the input data using the exponential moving average calculated by the bes() function.
The estdev function calculates the standard deviation using an exponential moving average method, rather than the traditional simple moving average method used by the stdev function. The exponential moving average method gives more weight to recent data, which can make the estdev more responsive to recent changes in volatility. This can make it more useful in certain types of analysis, such as identifying trends in volatility. Additionally, it also uses the same EMA algorithm to calculate the average value of the data set, which can help to keep the output of the estdev and average functions consistent.
The script also defines two more helper functions, average() and standard_deviation(), which allow the user to switch between using simple moving averages (SMA) and exponential moving averages (EMA) as the basis for the indicator. These functions take three arguments, the input data, the length of the moving average, and a string that specifies whether to use SMA or EMA.
The script then defines the input parameters for the indicator. The user can choose whether to use SMA or EMA as the basis for the indicator using the select parameter. The user can also specify the length of the moving average and the multiplier for the standard deviation using the length and multiplier parameters, respectively.
Finally, the script calculates the average and standard deviation of the input data using the selected method (SMA or EMA), and plots the upper and lower bands of the indicator. The upper band is calculated as the average plus the standard deviation multiplied by the specified multiplier, while the lower band is calculated as the average minus the standard deviation multiplied by the specified multiplier.

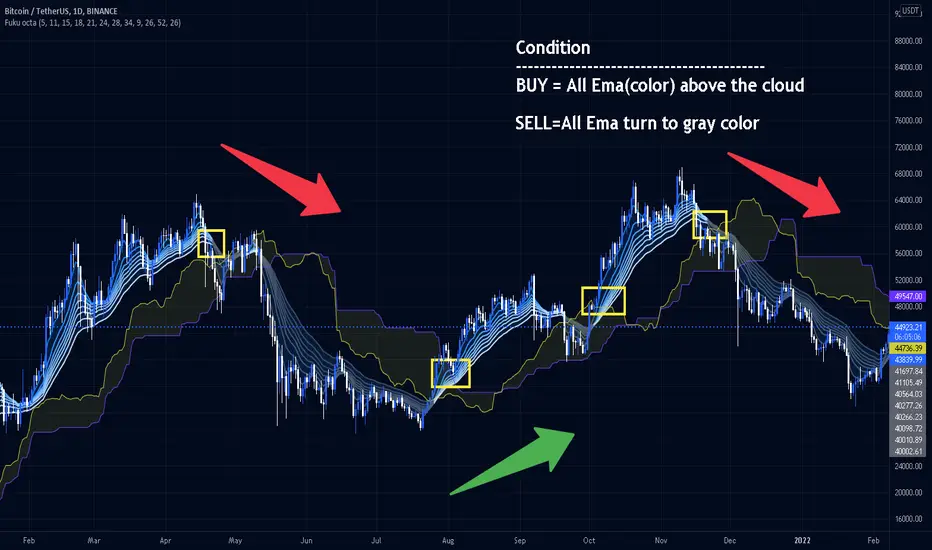
Fukuiz Octa-EMA + IchimokuThis indicator base on EMA of 8 different period and Ichimoku Cloud.
#A brief introduction to Ichimoku #
The Ichimoku Cloud is a collection of technical indicators that show support and resistance levels, as well as momentum and trend direction. It does this by taking multiple averages and plotting them on a chart. It also uses these figures to compute a “cloud” that attempts to forecast where the price may find support or resistance in the future.
#A brief introduction to EMA#
An exponential moving average (EMA) is a type of moving average (MA) that places a greater weight and significance on the most recent data points. The exponential moving average is also referred to as the exponentially weighted moving average. An exponentially weighted moving average reacts more significantly to recent price changes than a simple moving average (SMA), which applies an equal weight to all observations in the period.
I combine this together to help you reduce the false signals in Ichimoku.
#How to use#
EMA (Color) = Bullish trend
EMA (Gray) = Bearish trend
#Buy condition#
Buy = All Ema(color) above the cloud.
#Sell condition#
SELL= All Ema turn to gray color.
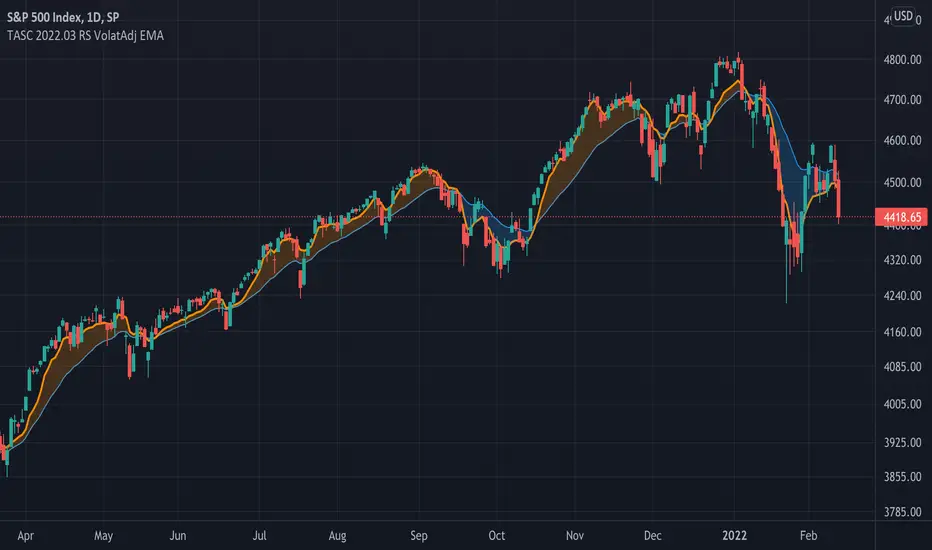
TASC 2022.03 Relative Strength Volatility-Adjusted EMA█ OVERVIEW
TASC's March 2022 edition of Traders' Tips includes the "Relative Strength Moving Averages - Part 3: The Relative Strength Volatility-Adjusted Exponential Moving Average" article authored by Vitali Apirine. This is the code that implements the "RS VolatAdj EMA" from the article.
█ CONCEPTS
In a three-part article series, Vitaly Apirine examines ways to filter price movements and define turning points by applying the Relative Strength concept to exponential moving averages . The resulting indicator is more responsive and is intended to account for the relative strength of volatility .
█ CALCULATIONS
The calculation process uses the following steps:
Select an appropriate volatility index (in our case it is VIX ).
Calculate up day volatility (UV) smoothed by a 10-day EMA.
Calculate down day volatility (DV) smoothed by a 10-day EMA.
Take the absolute value of the difference between UV and DV and divide by the sum of UV and DV. This is the Volatility Strength we need.
Calculate a MLTP constant - the weighting multiplier for an exponential moving average.
Combine Volatility Strength and MLTP to create an exponential moving average on current price data.
Join TradingView!
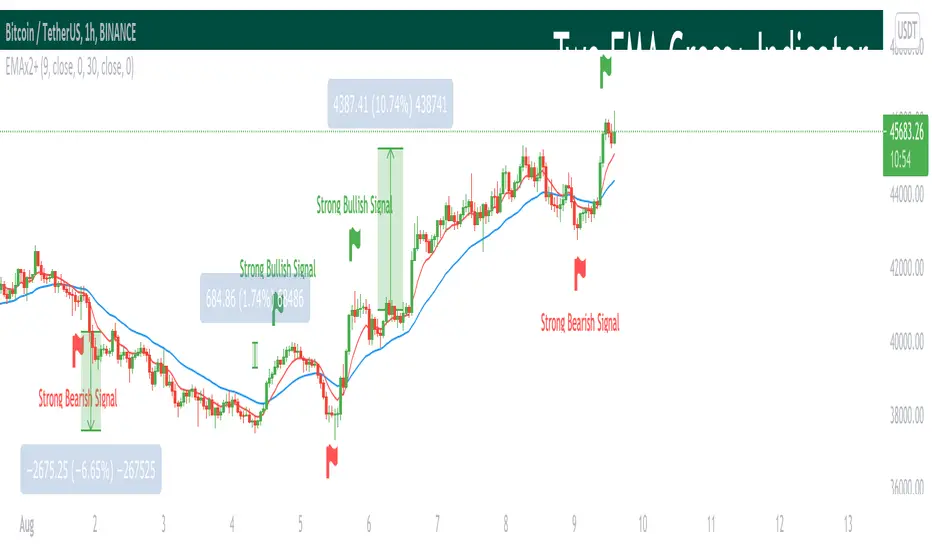
Two EMA Cross+ IndicatorHello traders!
Today we gonna demonstrate out heuristic of classical EMA Indicator. We decided to simplify your trading staff and add some meta data. So, let’s look at it from the very beginning and initially speak about what EMA is and then I’ll tell you why our indicator is extremely convenient and useful.
So, what is EMA? An exponential moving average ( EMA ) is a type of moving average (MA) that places a greater weight and significance on the most recent data points. The exponential moving average is also referred to as the exponentially weighted moving average . An exponentially weighted moving average reacts more significantly to recent price changes than a simple moving average ( SMA ), which applies an equal weight to all observations in the period.
Key takeaways:
-The EMA is a moving average that places a greater weight and significance on the most recent data points.
-Like all moving averages, this technical indicator is used to produce buy and sell signals based on crossovers and divergences from the historical average.
As you know, EMA Cross is one of basic and most popular Entry Indicators. It’s kinda easy to understand and even easier to use. This indicator consists of two EMAs - fast (red line) and slow (blue line). Fast EMA is EMA of less length that the fast EMA (default parameter is 9). Thus, it reacts the price change more actively than the slow. We can say that it takes into consideration the most actual price movements. Speaking about slow EMA (default parameter is 30) it’s more inert and it’s more difficult to change its action vastly. We can say that the EMA «looks» at the historical data more accurate, but doesn’t forget about actual price movements.
But how it works? Trivial. When the fast EMA crosses the slow bellow, it provides bearish signal, whereas when it crosses it above, it’s bullish signal. Even more, we added some «confirmation» factor. As you know, when the price is above the slow EMA, the slow EMA plays the role of support line for price and means that the price is in uptrend. Thus, when we see the cross above and it takes place under the price, we called it «strong Bullish Signal». When the price is bellow the slow EMA, slow EMA is resistance. Thus, when we see the cross bellow and it’s under the slow EMA, we called it «strong Bearish Signal».
To make your trading process easier, we plotted the places of crosses on the chart and added the descriptions of the crosses. The flags mean the place of cross. The default parameters have nice backtest on 1H chart. However, you can also change them depending on your goals and the time period. The places of cross looks like flags (red flag is «bearish» cross, green - «bullish»). As you can see, it’s really convenient.
I hope you’ll enjoy our heuristic of classical EMA Cross. We are sure that the meta data that we are taking into consideration makes the signals more accurate and the deals more profitable. The SkyRock Team with support of Trading View try to make your trading process more successful and profitable. Every day we works in conjunction to boost both your skills and trading balance. We hope, it’s really useful for you, dear traders!
Krown Moving Averages & Crossover LevelsIntroducing Krown Moving Averages with Crossover levels.
This indicator
Plots 5 Ema's and 3 SMA's ( Default Krown Periods )
It calculates the price levels at which each pair of moving averages would be equal .
That means that if price closes the other side of that level the pair of moving will cross also.
These levels can therefore be considered as " crossover levels....( the price level where each pair of moving averages will cross)
It can give crossover levels for
SMA crossing SMA
EMA crossing EMA
EMA crossing SMA
Plots optional Labels for all crossover levels....(off by default needs to be turned on in the settings)
Plots optional crossover levels as lines and dots colored as the 2 colors of the pair of moving averages.....(off by default needs to be turned on in the settings)
This indicator is aimed at traders who use simple and exponential moving average crossovers as part of their trading plan or edge.
It takes the guesswork out of knowing at what price level a pair of moving averages will cross which helps to improve entries and risk management.
There is an optional "Cutoff" function and user adjustable "limit factor" which cuts the plots off once they are too far below or above the current price to prevent chart auto focus issues.
There is a decimal place truncation option to set the decimal places depending on the asset type and price accuracy required.
Inspired by a request from a community member after one of my recent reverse engineered indicator publications.
I am publishing this open source in the hopes that some newer coders will find the functions interesting and useful.

Heikin-Ashi Smoothed with option to change MA types CryptoJoncisPine Script version=3
Author CryptoJoncis
Heikin-Ashi Smoothed
The Heikin-Ashi Smoothed study is based upon the standard Heikin-Ashi study with additional moving average calculations. The following is the calculation formula for the bars:
1. The current bar Open, High, Low, Close values are smoothed individually by using the moving average type specified by the Moving Average Type 1 Input with a length/period specified by the Moving Average Period 1 Input.
2. The Heikin-Ashi bar Open, High, Low, Close values are set using the smoothed values from step 1. This is performed using the standard Heikin-Ashi formula.
3. The final Heikin-Ashi Open, High, Low, Close values are calculated by doing a second smoothing of the bar values from step 2 by using the moving average type specified by the Moving Average Type 2 Input with a length/period specified by the Moving Average Period 2 Input.
If you choose to tick the box where it offers to use only one smoothed HA then it skips the third/final step and you do not need to choose the second MA type for it to work.
Remember, using FRAMA, always make sure you use even number for length.
For simple Heikin-Ashi, please tick single smoothed and DEFAULT (Not smoothed as there are no MA used)
Heikin-Ashi bars are calculated:
1. Close = (Open + High + Low + Close) / 4
This is the average price of the current bar.
2. Open = (Open of Previous Bar + Close of Previous Bar) / 2
This is the midpoint of the previous bar.
3. High = Max of (High, Open, Close)
Highest value of the three.
4. Low = Min of (Low, Open, Close)
Lowest value of the three.
Any questions/suggestions/errors or spelling mistakes? Please leave a comment and let me know. I will try to fix it.
This took me few days to finish, so I hope you will find it useful.
Would you like to have more MA type choices? Please comment down with any other which aren't included in this indicator and I will research them and add.
MA included in this script:
Tillson Moving Average (T3)
Double Exponential Moving Average (DEMA)
Arnaud Legoux Moving Average (ALMA)
Least Squares Moving Average (LSMA)
Simple Moving Average (SMA)
Exponential Moving Average (EMA)
Weighted Moving Average (WMA)
Smoothed Moving Average (SMMA)
Triple Exponential Moving Average (TEMA)
Hull Moving Average (HMA)
Adaptive moving average (AMA)
Fractal Adaptive Moving Average (FAMA)
Variable Index Dynamic Average (VIDYA)
Triangular Moving Average (TRIMA)
You can use,publish,modify this code in any way as you wish, but only if you reference me after.
You are not allowed to sell it as it is.
If this code is useful to you, then consider to buy me a coffee (or better a pint of beer) by donating Bitcoin or Etherium to:
BTC: 3FiBnveHo3YW6DSiPEmoCFCyCnsrWS3JBR
ETH: 0xac290B4A721f5ef75b0971F1102e01E1942A4578
References:
www.sierrachart.com
www.investopedia.com
www.binarytribune.com
www.investopedia.com
www.stockfetcher.com
www.mql5.com
www.incrediblecharts.com
help.cqg.com
www.blastchart.com